

Station overview—Boyne Island
Map marker is indicative only. It does not reflect the exact location of the station.
See all stations in Gladstone region.
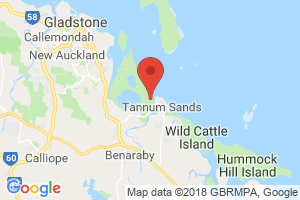
Established in October 2008, the monitoring station is located in the northern part of the Boyne Island residential community.
Modelling indicates this area of Boyne Island and Tannum Sands is likely to experience the greatest impacts from industrial air emissions.
As part of the Clean and Healthy Air for Gladstone Project, the station measured levels of a range of hazardous air pollutants including heavy metals and organic compounds between November 2008 and June 2010.
- Monitoring period
- 1 October 2008–
- Parameters monitored
Current measurements at 9pm 27 February 2026
| Parameter | Measurement | Running average |
|---|---|---|
| Particle PM2.5 | 2.4µg/m³ | 3.7µg/m³ (24hr avg) |
| Particle PM10 | 6.7µg/m³ | 10.5µg/m³ (24hr avg) |
| Carbon monoxide | 0ppm | 0ppm (8hr avg) |
| Nitrogen dioxide | 0ppm | 0ppm (1hr avg) |
| Sulfur dioxide | 0ppm | 0ppm (1hr avg) |
| Visibility | 8Mm⁻¹ | 8Mm⁻¹ (1hr avg) |
| Parameter | Measurement |
|---|---|
| Wind direction | 160deg |
| Wind speed | 2.5m/s |
| Humidity | 92.4% |
| Temperature | - |
| Solar radiation | 0W/m² |
| Rainfall | 0.3mm |
Legend to air quality category colours about category values
- Good
- Fair
- Poor
- Very poor
- Extremely poor
None of the data is validated (0% validated, 0/12 records)
About air quality categories
Air quality categories are used to make it easier to interpret air quality data by reducing the complexity associated with different pollutant concentration units and air quality guideline values.
Each air quality measurement from a monitoring station is assigned an air quality category rating based on comparison of the measurement value against the relevant air quality guideline. Five colour-coded air quality categories are used, being ‘Good’ (green), ‘Fair’ (yellow), ‘Poor’ (orange), ‘Very poor’ (red) or ‘Extremely poor’ (dark red). Values greater than the air quality guideline will be appear as ‘Poor’, ‘Very poor’ or ‘Extremely poor’.
About these parameters
- Particle PM2.5
Airborne particles less than 2.5 micrometres in diameter, referred to as PM2.5, can be hazardous to human health or cause a nuisance when present in the air at elevated levels. They are capable of penetrating the lower airways of humans and can cause possible negative health effects.
The guideline for Particle PM2.5 is 50µg/m³ (1hr avg) and 25µg/m³ (24hr avg).
Particle PM2.5 is measured in micrograms per cubic metre.
- Particle PM10
Airborne particles less than 10 micrometres in diameter, referred to as PM10, can be hazardous to human health or cause a nuisance when present in the air at elevated levels. They are capable of penetrating the lower airways of humans and can cause possible negative health effects.
The guideline for Particle PM10 is 100µg/m³ (1hr avg) and 50µg/m³ (24hr avg).
Particle PM10 is measured in micrograms per cubic metre.
- Carbon monoxide
Carbon monoxide is a colourless, odourless gas formed when substances containing carbon (such as petrol, gas, coal and wood) are burned with an insufficient supply of air. It has serious health impacts on humans and animals, especially those with cardiovascular disease.
The guideline for Carbon monoxide is 9ppm (8hr avg).
Carbon monoxide is measured in parts per million.
- Nitrogen dioxide
Nitrogen dioxide is an acidic and highly corrosive gas. Nitrogen oxides are critical components of photochemical smog. Long-term exposure to high levels of nitrogen dioxide can cause chronic lung disease and affect the senses.
The guideline for Nitrogen dioxide is 0.08ppm (1hr avg).
Nitrogen dioxide is measured in parts per million.
- Sulfur dioxide
Sulfur dioxide (SO2) is a colourless gas with a sharp, irritating odour. It is produced by burning fossil fuels and by the smelting of mineral ores that contain sulfur.
The guideline for Sulfur dioxide is 0.1ppm (1hr avg).
Sulfur dioxide is measured in parts per million.
- Visibility
Aerosols and fine particles can reduce visibility. Smoke from fires or haze are common causes of poor visibility.
The guideline for Visibility is 235Mm⁻¹ (1hr avg).
Visibility is measured in inverse megametres.
- Wind direction
When high pollutant concentrations occur at a monitoring station, wind data records can determine the general direction and area of the emissions. Identifying the sources means planning to reduce the impacts on air quality can take place. The measurement indicates the direction the wind is coming from.
Wind direction is measured in degrees.
- Wind speed
When high pollutant concentrations occur at a monitoring station, wind data records can determine the general direction and area of the emissions. Identifying the sources means planning to reduce the impacts on air quality can take place.
Wind speed is measured in metres per second.
- Humidity
Like temperature and solar radiation, water vapour plays an important role in many thermal and photochemical reactions in the atmosphere.
Humidity is measured in percentage.
- Temperature
Measuring temperature supports air quality assessment, air quality modelling and forecasting activities.
Temperature is measured in degrees Celsius.
- Solar radiation
Measuring solar radiation is beneficial for modelling photochemical smog events, as the intensity of sunlight has an important influence on the rate of the chemical reactions that produce the smog. The cloudiness of the sky, time of day and geographic location all affect sunlight intensity.
- Rainfall
Rain has a ‘scavenging’ effect when it washes particulate matter out of the atmosphere and dissolves gaseous pollutants. Removing particles improves visibility. Where there is frequent high rainfall, air quality is generally better.
