

Station overview—Gatton
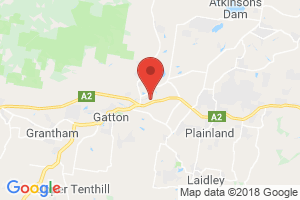
Map marker is indicative only. It does not reflect the exact location of the station.
See all stations in South East Queensland region.
Solar powered meteorological instruments at the Gatton site collect data used for air quality modelling in South East Queensland.
- Monitoring period
- 1 January 2016–
- Parameters monitored
Current measurements at 12pm 27 February 2026
| Parameter | Measurement |
|---|---|
| Wind direction | 129deg |
| Wind speed | 4.4m/s |
| Humidity | 86.4% |
| Temperature | 23.9°C |
| Rainfall | 0mm |
Legend to air quality category colours about category values
- Good
- Fair
- Poor
- Very poor
- Extremely poor
None of the data is validated (0% validated, 0/5 records)
About air quality categories
Air quality categories are used to make it easier to interpret air quality data by reducing the complexity associated with different pollutant concentration units and air quality guideline values.
Each air quality measurement from a monitoring station is assigned an air quality category rating based on comparison of the measurement value against the relevant air quality guideline. Five colour-coded air quality categories are used, being ‘Good’ (green), ‘Fair’ (yellow), ‘Poor’ (orange), ‘Very poor’ (red) or ‘Extremely poor’ (dark red). Values greater than the air quality guideline will be appear as ‘Poor’, ‘Very poor’ or ‘Extremely poor’.
About these parameters
- Wind direction
When high pollutant concentrations occur at a monitoring station, wind data records can determine the general direction and area of the emissions. Identifying the sources means planning to reduce the impacts on air quality can take place. The measurement indicates the direction the wind is coming from.
Wind direction is measured in degrees.
- Wind speed
When high pollutant concentrations occur at a monitoring station, wind data records can determine the general direction and area of the emissions. Identifying the sources means planning to reduce the impacts on air quality can take place.
Wind speed is measured in metres per second.
- Humidity
Like temperature and solar radiation, water vapour plays an important role in many thermal and photochemical reactions in the atmosphere.
Humidity is measured in percentage.
- Temperature
Measuring temperature supports air quality assessment, air quality modelling and forecasting activities.
Temperature is measured in degrees Celsius.
- Rainfall
Rain has a ‘scavenging’ effect when it washes particulate matter out of the atmosphere and dissolves gaseous pollutants. Removing particles improves visibility. Where there is frequent high rainfall, air quality is generally better.
