Station overview—Flinders View

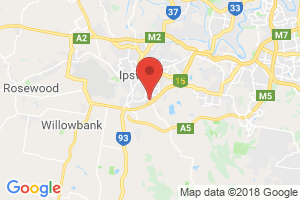
Map marker is indicative only. It does not reflect the exact location of the station.
See all stations in South East Queensland region.
Established in 1993, the Flinders View station measures pollutant concentrations in the Ipswich area, and the movement of pollutants within South East Queensland.
- Monitoring period
- 1 January 2000–
- Parameters monitored
- Nitrogen dioxide
- Ozone
- Particle PM10
- Sulfur dioxide
- Visibility
- Humidity
- Rainfall
- Temperature
- Wind direction
- Wind speed
Current measurements at 12pm 6 December 2019
Parameter | Air quality index | Measurement | Running average |
---|---|---|---|
Particle PM10 | 85fair | 18.7µg/m³ | 42.3µg/m³ (24hr avg) |
Visibility | 6very good | 15Mm⁻¹ | 15Mm⁻¹ (1hr avg) |
Nitrogen dioxide | 3very good | 0.003ppm | 0.003ppm (1hr avg) |
Ozone | 40good | 0.04ppm | 0.04ppm (1hr avg) |
Sulfur dioxide | 0very good | 0ppm | 0ppm (1hr avg) |
Parameter | Measurement |
---|---|
Wind direction | 328deg |
Wind speed | 0.8m/s |
Humidity | 10.5% |
Temperature | 35.7°C |
Rainfall | 0mm |
Legend to air quality index colours about index values
- Very good 0–33
- Good 34–66
- Fair 67–99
- Poor 100–149
- Very poor >150
None of the data is validated (0% validated, 0/10 records)
About air quality index values
Our scientists create an air quality index by converting measured pollutant concentrations into index values which make it easier to interpret air quality data by reducing the complexity associated with pollutant concentrations.
The index value is the pollutant concentration expressed as a proportion of the National Environment Protection Measure for Ambient Air Quality (Air NEPM) standard or the Environmental Protection (Air) Policy 2008 (Air EPP) objective.